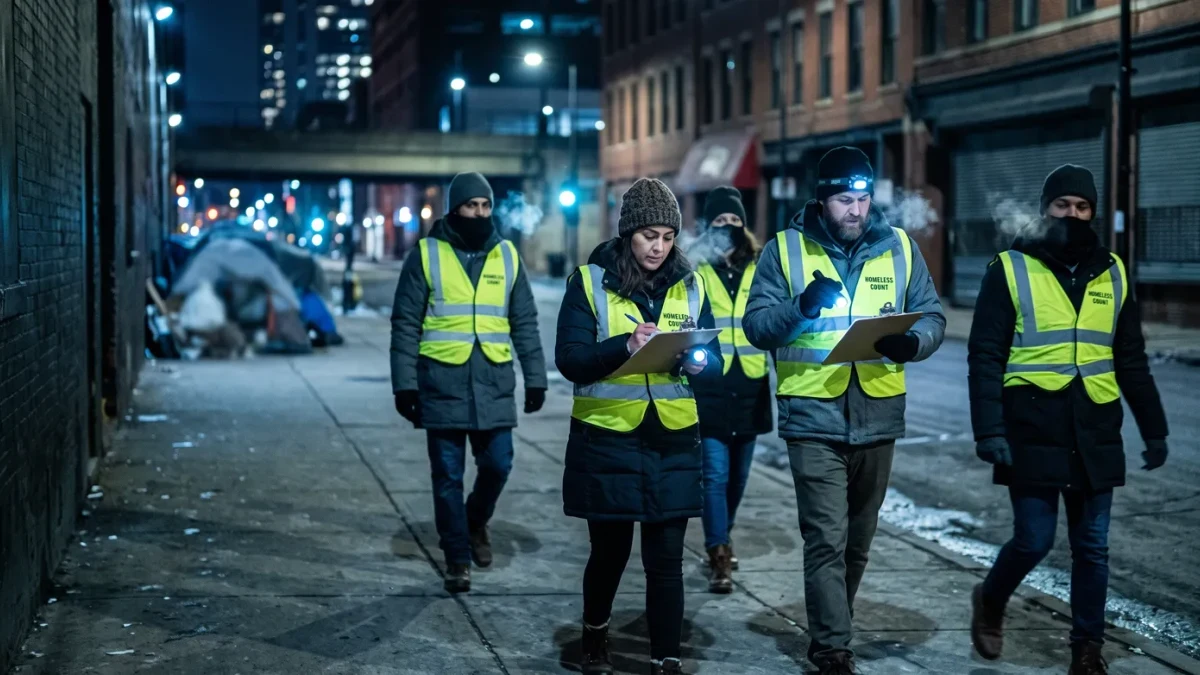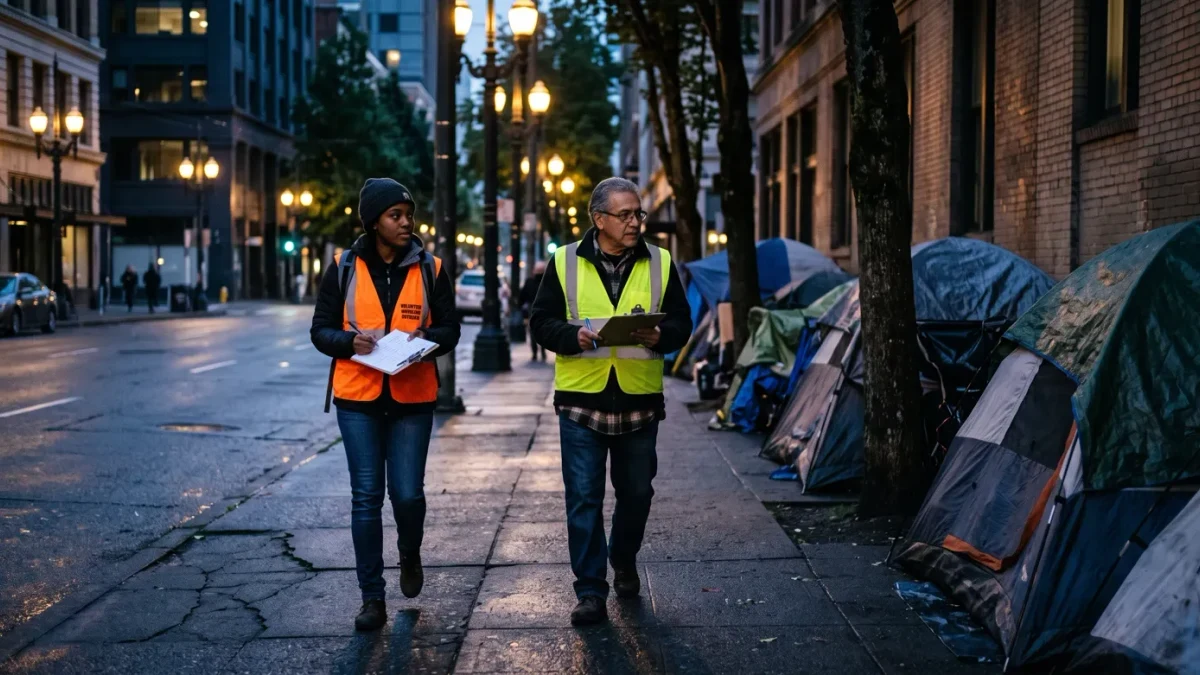
Every January, on a single night, thousands of volunteers fan out with clipboards and count. The point-in-time count, mandated by the Department of Housing and Urban Development since 2005, produces the number the country uses to argue about homelessness, and the recent numbers argued loudly: the January 2024 count found roughly 771,000 people homeless, an 18 percent one-year jump and the highest since reporting began, driven, HUD's report documented, by rising rents and the expiry of pandemic-era supports, with family homelessness surging fastest. The January 2026 count, conducted while this analysis window closes, will test whether the trend bent.
What the count measures, and what it misses
The PIT is a census of sheltered and unsheltered people on one night, conducted by continuums of care, the regional planning bodies that administer federal homeless-services funding. Its virtues are comparability and longevity; its documented limits are undercounting and definition. People doubled up with family, the most common precursor condition, are not counted at all. Unsheltered counts depend on volunteer coverage of encampments, and methodology varies by city, which is why year-over-year swings in a single region are read with caution while the national trend is treated as the signal. HUD itself footnotes all of this, and researchers triangulate with school-district homeless counts under a broader federal definition, which run well above a million students, and with Emergency Shelter utilization data.
What drove the record numbers?
The documented drivers are rental-market mechanics more than individual circumstances. HUD's 2024 analysis and the academic literature converge: homelessness rates track median rent and vacancy at the metro level with brutal regularity, the West Coast and Northeast, high-rent, low-vacancy regions, show rates several multiples of the Midwest's. The expiry of Emergency Rental Assistance and enhanced supports removed the dam, and family homelessness, the most program-sensitive category, jumped hardest, an echo of the same pattern the Census supplemental poverty series documented when the expanded Child Tax Credit lapsed.
What has policy done since?
The documented responses split into visible and structural. Visible: encampment sweeps in large cities, documented by local journalism with follow-up tracking that shows most swept residents relocating rather than exiting homelessness, and shelter expansion funded by one-time federal relief whose cliffs recur annually. Structural: housing-first permanent supportive housing, whose randomized-trial record for chronic homelessness remains the strongest in the field; hotel and motel conversions, which several states funded at documented scale; and the quieter zoning reforms, legalizing duplexes and accessory units, that operate on the underlying rent curve with a lag of years. Federal policy in 2025 added pressure from a different direction, with the administration's enforcement posture and funding disputes, reported by Reuters and others, injecting uncertainty into the service system the count depends on.
Why employers and counties should care
The count is a labor-market document. Polling and program data consistently show large shares of homeless adults working, in gig, day-labor, and low-wage service jobs, and shelter-adjacent employment is documented in every regional workforce study: the crisis is a wage-rent arithmetic problem as much as a benefits problem. For counties, the fiscal line is direct: emergency medical care, jails, and shelter cost more per person per year than the supportive housing that exits people from the system, a differential documented in dozens of local cost studies, which is why several conservative counties, on the fiscal record alone, became housing-first converts.
How to read the 2026 number when it lands
HUD publishes the annual report, the Annual Homeless Assessment Report to Congress, late in the year, so spring readers see continuation grants and local tallies first. Watch three disaggregations rather than the headline: family homelessness, the category most responsive to rental assistance; chronic homelessness among individuals, the category most responsive to supportive housing; and veteran homelessness, the category with the most dedicated federal pipeline, which has fallen by roughly half over the decade and proves the system can move a number when it is funded to. The count is an instrument, imperfect and indispensable, and the honest reading treats it the way the best local reporters do: as the year's evidence in an argument about rent.