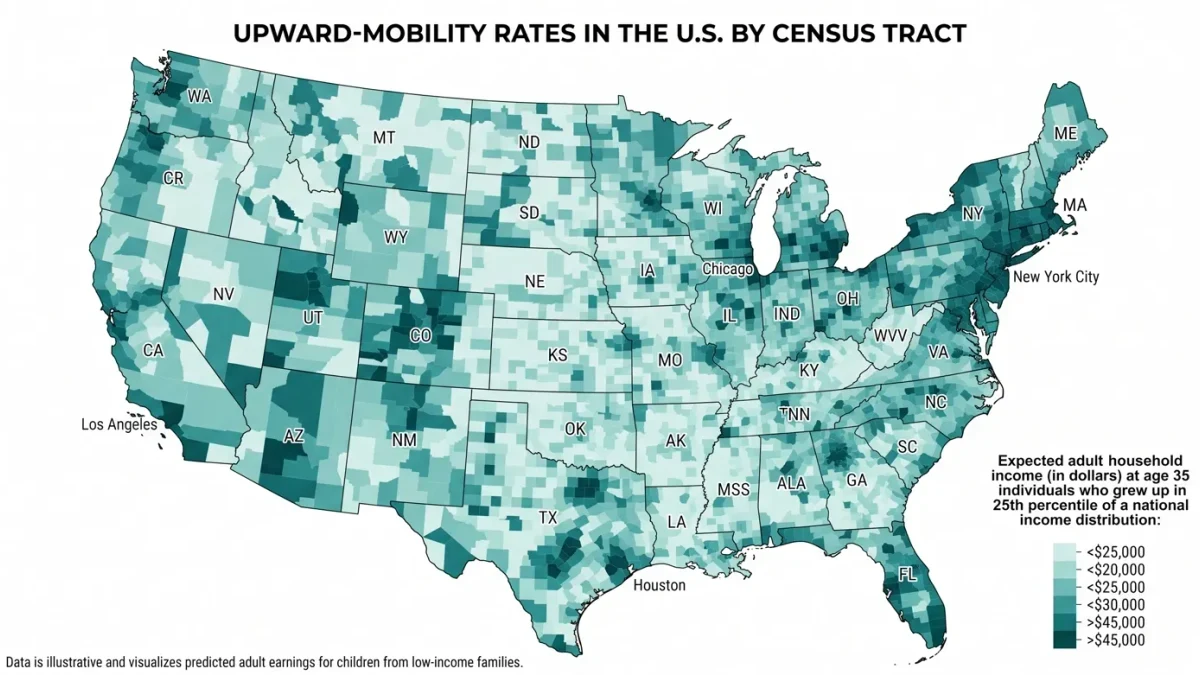
The most consequential social-science dataset of the era matched tax records to childhood addresses and answered a question sociology had argued about for decades: economic mobility is set substantially by where you grow up. The Opportunity Atlas work of Raj Chetty and collaborators, covering tens of millions of Americans, documents that a child born to bottom-quintile parents in a high-mobility neighborhood earns thousands of dollars more per year at thirty-five than the same child in a low-mobility one, differences of tens of thousands in lifetime income attributable to census tract, not talent.
What does the mobility map show?
The documented geography is stubborn. The strongest upward mobility concentrates in the upper Midwest and Plains, the upper Northeast, and parts of the West, while the Southeast, urban cores of the industrial Midwest, and much of the reservation West document the lowest rates. A Black child's and a white child's mobility differ sharply within the same metro, a documented gap driven substantially by neighborhood segregation itself. And the map is durable: areas that were mobile decades ago mostly still are, suggesting the causes are structural, sewers of opportunity laid long ago and maintained, rather than transient luck.
What neighborhood features raise mobility?
The follow-on research, correlating tract outcomes with observable features, documents a consistent five: residential integration, economic and racial mixing, which exposes poor children to the networks, norms, and schools of the middle class; two-parent or stable-caregiver presence at the community level, which the data associates with boys' outcomes most strongly; school quality, measurable in test-score growth rather than level; social capital, membership and volunteering density, the Putnam lineage quantified at tract level; and low commute times to jobs, connectivity that employment actually reaches. Crime exposure, the violence studies add, suppresses mobility directly, with documented effects of concentrated violence on school attendance and graduation.
What did the moving experiments prove?
The strongest causal evidence came from experiments in moving. Reanalysis of the Moving to Opportunity program, which randomized housing vouchers across cities in the 1990s, documented large adult earnings gains for children who moved to lower-poverty neighborhoods before roughly age thirteen, and negligible effects for older movers, a critical window the field now treats as established. Chetty's later work on the CMTO experiment in Seattle showed that with modest search assistance and landlord outreach, voucher families moved to high-opportunity neighborhoods at many times the usual rate, proving the barrier was friction and discrimination in search, not preference, and that the fix is administratively cheap.
What does this mean for policy and for business?
The policy menu the research supports is specific: mobility dollars follow housing, zoning reform that permits mixed-income housing inside high-opportunity zip codes, voucher administration that helps families cross jurisdictional lines, and school-finance structures that do not tie quality to local wealth. For employers, the record reads differently: the low-mobility tracts are the labor sheds of warehouses, retail, and service work, and the documented within-firm mobility, who gets promoted from entry roles, is a firm-level variable the opportunity research is only beginning to measure. A company whose entry-level jobs in low-mobility neighborhoods never lead anywhere is participating in the map, whether or not it appears on it.
What should a reader conclude?
The comfortable reading, that the map is destiny, is wrong on the evidence: the moving experiments changed outcomes, and the neighborhood features are policy variables, not weather. The uncomfortable reading stands: American opportunity is geographically rationed, by decades of zoning, segregation, and school-finance choices, and the data that documents it now sits in public, tract by tract, free to anyone willing to look up their own address and ask what it predicts.