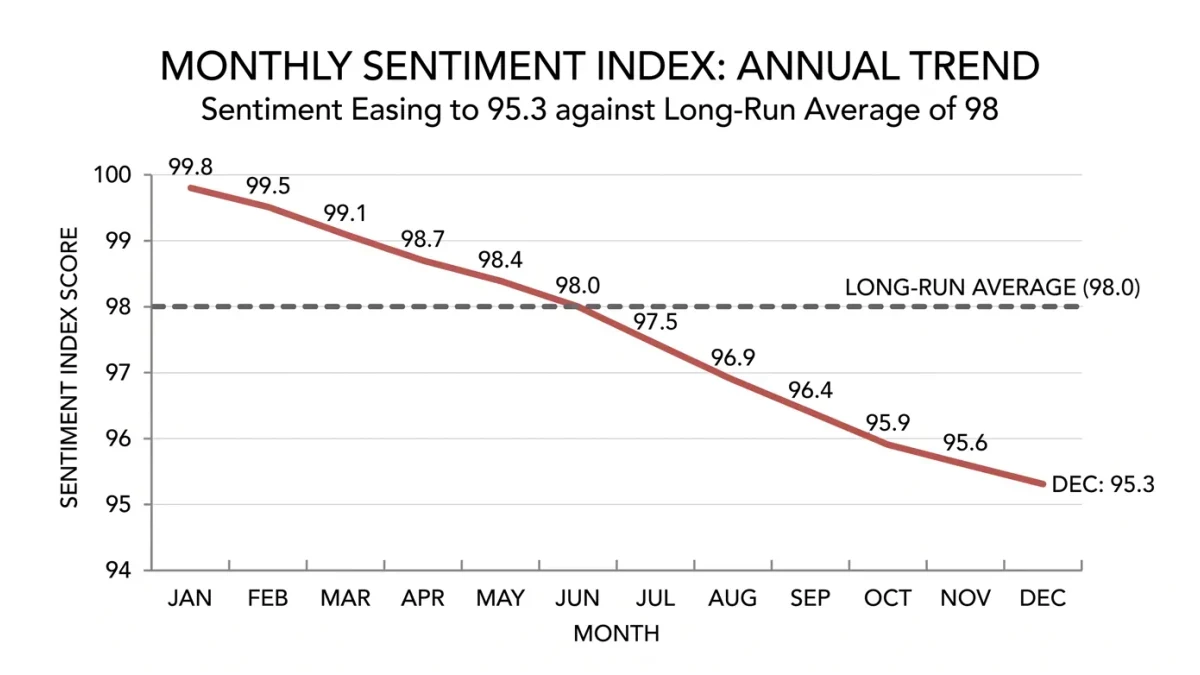
Small business optimism, as measured by the National Federation of Independent Business's monthly survey of roughly 20,000 member firms, jumped after the November 2024 election to one of its highest readings in decades before settling back toward its historical average through 2025. That arc, a spike of expectation followed by a grind of reality, is a useful tutorial in what the index can and cannot tell you about the economy of towns and strip malls.
What is the index actually measuring?
The Optimism Index averages ten survey questions put to a rotating panel of NFIB member firms, almost all of them under 50 employees. Owners are asked about plans to hire, plans to make capital outlays, expectations for sales, credit conditions, inventory satisfaction, earnings trends, and whether the next three months are a good time to expand. The composite is indexed so that 100 equals its 1986 average. The survey is a sentiment instrument, not a sales report: it records what owners expect, weeks before the data exists to check them.
Its companion, the Uncertainty Index, built from the share of owners answering unsure to forecast questions, has become nearly as influential. In late 2024 it hit a record high, with roughly one in four owners unable to forecast business conditions, a reading economists at the Federal Reserve and elsewhere cited as a real dampener on hiring and investment even among firms reporting decent sales.
Why did optimism surge and then fade?
The post-election spike was concentrated in a single component: expectations about business conditions six months out, which leapt by double digits in a month, the sharpest move in the survey's history. Owners also reported a marked improvement in sales expectations. But the components tied to current operations, earnings trends and actual hiring plans, improved far more modestly. That asymmetry is the classic signature of a partisan-expectation shock: red-leaning and blue-leaning owners have long answered this survey differently depending on who won, and economists have documented that gap growing since 2016.
Through 2025 the composite drifted down from its peak as the harder parts of governing, tariff announcements, immigration enforcement in labor-intensive trades, and interest rates that stayed higher for longer, showed up in the comments owners attach to their answers. Inflation and labor quality remained the two most cited problems throughout, a continuity that predated the election and outlasted the spike.
What does the index correlate with in the real economy?
Because most member firms are in construction, retail, and services, the survey tracks hiring intentions that show up later in the ADP small-business payrolls series and in the Bureau of Labor Statistics' births and deaths adjustment, the mechanism that adds new-firm employment to the jobs report. Historically, sustained index moves above or below 98 have led private payroll growth by a quarter or two. The relationship is loose at the monthly level, which is why analysts watch the three-month average rather than any single print.
How should a reader use it responsibly?
Three cautions are documented. The panel is members of an advocacy organization, not a random sample of all small firms, and its politics skew conservative, which colors expectation questions around elections. The ten components can point in opposite directions, so the composite alone can mislead, as it did in late 2024 when record optimism coexisted with record uncertainty. And the survey says nothing about the roughly 40 percent of small-business employment at firms too young or too informal to answer trade surveys.
Used with those limits in mind, the index remains the fastest monthly read on the employer half of Main Street. Its long-run average sits stubbornly below 100, a fact owners' groups cite as evidence of chronic policy drag and economists cite as evidence of a healthy griping baseline. Both readings are, in their way, documented.
What matters in the 2026 readings?
Watch the capital-outlays and credit-questions components. They respond fastest to interest-rate policy, and they determine whether small firms renovate, buy equipment, and add shifts. If optimism stays average but those two series improve, Main Street investment is gathering regardless of the headline. If the headline stays high while hiring plans sag, the spike was expectation, not expansion. The index does not predict the economy so much as record what owners believe, and the recent record shows beliefs moving much faster than payrolls ever do.